Joking aside when I'm analyzing the markets I find myself viewing it as a big conspiracy theory to screw the retail traders out of their money. I find myself trying to determine what the large institutions intentions are by looking at my Morris code, Price and Volume. I know it sounds flaky but fear and greed rule these markets and we humans are creatures of habit. If you beginning to view the market not as a participant but as an outsider watching this psychological experiment known as the stock market unfold you will be quite surprised to see that the same human patterns occur time and time again.
Raise your hand if you were long this market and found your underwear a bit heavier today. To state the obvious, the market has been rocked in the past two days. Today's volume on the SPY was the highest since May 18, 2012. Its funny how the highest volume days in the past few years have all been on down days. You can almost see the fear splattered all over the charts.
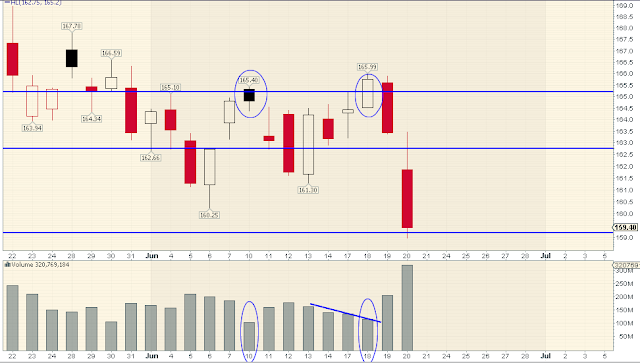
Lets try to rationalize what lead to this nasty fall using the tenets of support and resistance, supply and demand as I have been yammering about since I start this groundbreaking blog. Below is a daily SPY candlestick chart with our support and resistance levels I have mentioned far too many times to count. $165.2, $162.75 and $159.21 (see PnF below).
In order to break resistance we need demand to overcome supply. On June 10th (first blue circle) price hit resistance on lower than average volume. This indicated that there was no interest to move prices higher. This lack of demand lead to prices falling thereafter. The days leading up to this Wednesday's drop you can see price was moving up on decreasing volume again as it approached the resistance area of $165.20. I won't deny that price broke the $165.2 resistance area however, I would have waited for a test of this broken resistance to confirm it as support. That means I would have waited for price to come back down to $165.2 on lower volume (indicating lack of supply) and then a bounce above the high of the previous day ($165.99) before I would have been convinced the higher prices were in order. Instead price tanked the next day on higher than average volume indicating supply entered the market with price closing near the lows for the day. That was bearish. Today we gapped below $162.75 and headed to he next level of support at $159.21 on very high volume closing near the lows of the day.
In order to break resistance we need demand to overcome supply. On June 10th (first blue circle) price hit resistance on lower than average volume. This indicated that there was no interest to move prices higher. This lack of demand lead to prices falling thereafter. The days leading up to this Wednesday's drop you can see price was moving up on decreasing volume again as it approached the resistance area of $165.20. I won't deny that price broke the $165.2 resistance area however, I would have waited for a test of this broken resistance to confirm it as support. That means I would have waited for price to come back down to $165.2 on lower volume (indicating lack of supply) and then a bounce above the high of the previous day ($165.99) before I would have been convinced the higher prices were in order. Instead price tanked the next day on higher than average volume indicating supply entered the market with price closing near the lows for the day. That was bearish. Today we gapped below $162.75 and headed to he next level of support at $159.21 on very high volume closing near the lows of the day.

The close near the lows of the day is bearish/ Although the extremely high volume indicates a large transfer of ownership between the weak and strong hands (or what some call accumulation) has begun. This may be the early stages of a larger drop to come in which we will look to see where the next support level it to prepare for a possible long position. If these two last daily price bars and the associate volume had occurred after a well defined downtrend I would have viewed this as the final 'shaking of the tree' and would be more bullish. If that were the case, then I would simply wait for a weak bounce from support and an eventual test of support on lower volume indicating supply has been absorbed. For now I will just wait and see how things play out and tell you in hindsight how right I was. :)
Thanks for reading
Note: This is where the $159.21 support level came from. Why? Significant move higher after resistance broke.

Thanks for reading
Note: This is where the $159.21 support level came from. Why? Significant move higher after resistance broke.

No comments:
Post a Comment