The market is currently ping ponging between a few price points. I've been rambling on for the past week or so about the 50dma, 20dma and $165 and $162.80 as areas of support and resistance. I've posted again yesterdays PnF chart to show why the $165 area was significant The blue box shows what price did when $165 (in the case $165.20) broke support (supply overcame demand) and when $165 subsequently acted as resistance (supply overcame demand). Why $165? Because the price move was significant. After $165 support was broken (point A) price moved lower to $160.30 on the PnF chart before reversing. After price rallied back to the $165 (point B) area price again reversed this time dropping to $161.35.

So what happened today? Below is a 15min candlestick chart with the support and resistance area of $165.20 and $162.75 derived from the PnF chart above. Just a note that although the original numbers identified last week were $165 and $162.80, due to changes in volatility the numbers have changed slightly, which as I wrote about yesterday is well within the margin of error. The other point I'd like to make is that PnF charts are leading indicators of price (if that actually makes any sense) so you know in advance where the areas of support and resistance are to help make your trading decisions.
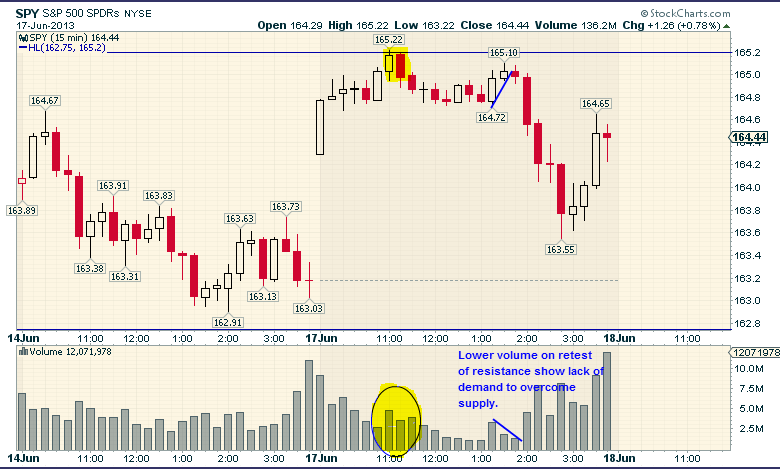
Again lets hammer home the process. We have our support and resistance areas which represent where the battle of demand and supply has happened in the past before a significant price move occurred. We also know volume is our primary indicator of supply and demand. So now what? That is right..lets see what volume did at these levels! (I now forgive you for believing ping pong was the guy that invented table tennis.) Above you will see as price approached the $165.20 area of resistance we saw a volume increase. However, because the candlestick at 11:00am closed near its highs I would not have considered shorting here. We are looking to see who wins the battle of supply and demand at these support and resistance areas. An increase of volume near resistance can either mean a transfer of stock from the big boys to the small retailers (bearish) or the big boys absorbing the supply for a potential break above resistance (bullish). So we wait and see. With the next 15min candlestick price drops which signals to me that its the former (big boys dumping to retailers). However, if one was so inclined to short, waiting for confirmation that indeed there was no demand for higher price levels on a potential test of the same resistance area on declining volume, would have been prudent. Declining volume means declining demand and we know in order to overcome the overhead supply at resistance you need an increase in demand. This is exactly what happened at around 1:30pm when price again tested resistance on significantly lower volume. Shortly after supply came in strong with a large increase in volume with each bearish price bar closing near the bottom of the price range.
Again we ask the question so now what. Again I answer I don't know! However, price on the daily chart did close slightly below its 20 day moving average ($164.49) we mentioned yesterday and today's volume was the lowest it has been for the past 5 days. Support and Resistance. Demand and Supply. Ping Pong and Table Tennis.
Thanks for reading.
No comments:
Post a Comment